Mon–Sat, 10:00 AM – 7:00 PM IST · Serving scholars worldwideClient login
Platforms & tools

The software behind better research

Statistics, structural equation modelling, qualitative analysis and engineering simulation — hover or tap any platform to see what it is used for and how we help.

SPSS logo

SPSS

Statistics Hover for details

Used for

Survey and questionnaire data, descriptive and inferential statistics in social science, management, education and health research.

What we do in it

  • Data cleaning, coding and screening
  • Reliability, normality and descriptive tests
  • t-test, ANOVA, chi-square, correlation, regression
  • EFA and APA-style output tables

SmartPLS logo

SmartPLS

SEM Hover for details

Used for

PLS-SEM for complex models, small samples and prediction-focused research in management and behavioural studies.

What we do in it

  • Measurement model: reliability, AVE, HTMT
  • Structural model: paths, R², f², Q²
  • Mediation, moderation and multi-group analysis
  • Bootstrapping and results interpretation

AMOS

SEM Hover for details

Used for

Covariance-based SEM and confirmatory factor analysis for theory-testing research.

What we do in it

  • CFA and model-fit indices (CFI, TLI, RMSEA)
  • Path and full structural models
  • Model modification and validity checks
  • Publication-ready path diagrams
STATA logo

STATA

Econometrics Hover for details

Used for

Econometrics, panel data and health or policy research that needs reproducible, script-based analysis.

What we do in it

  • Panel data: fixed and random effects, GMM
  • Logit, probit and survival models
  • Do-file scripting for reproducibility
  • Regression tables and diagnostics

EViews

Time series Hover for details

Used for

Time-series econometrics and forecasting in economics and finance research.

What we do in it

  • Unit root and stationarity tests
  • ARDL, VAR, VECM and cointegration
  • ARCH / GARCH volatility models
  • Forecasting and diagnostic checks
R logo

R

Statistics Hover for details

Used for

Advanced statistics, reproducible analysis and high-quality graphics across every discipline.

What we do in it

  • Statistical modelling and meta-analysis
  • Mixed models and multivariate analysis
  • ggplot2 publication-quality charts
  • R Markdown reproducible reports
Python logo

Python

Data science Hover for details

Used for

Data science, machine learning, text mining and automation for research projects.

What we do in it

  • Data cleaning with pandas and NumPy
  • Machine learning with scikit-learn
  • NLP, sentiment and text analysis
  • Visualisation and Jupyter notebooks
Minitab logo

Minitab

Quality Hover for details

Used for

Quality improvement, Six Sigma, design of experiments and industrial statistics.

What we do in it

  • Design of experiments (DOE)
  • Control charts and process capability
  • Regression and ANOVA
  • Six Sigma project analysis
JASP logojamovi logo

JASP & jamovi

Statistics Hover for details

Used for

Free, point-and-click statistics with Bayesian options — ideal for students without SPSS licences.

What we do in it

  • Frequentist and Bayesian tests
  • Factor analysis and reliability
  • APA-formatted output
  • Training on free alternatives to SPSS
NVivo logo

NVivo

Qualitative Hover for details

Used for

Qualitative analysis of interviews, focus groups, documents and open-ended survey responses.

What we do in it

  • Transcript import and coding
  • Thematic and framework analysis
  • Word clouds, matrices and queries
  • Write-up of themes with evidence
ATLAS.ti logo

ATLAS.ti

Qualitative Hover for details

Used for

Qualitative and mixed-methods research, grounded theory and network-based coding.

What we do in it

  • Code-book development
  • Grounded theory coding
  • Network views and co-occurrence
  • Qualitative reports
MAXQDA logo

MAXQDA

Mixed methods Hover for details

Used for

Qualitative and mixed-methods analysis of text, audio, video and survey data.

What we do in it

  • Coding and memoing
  • Mixed-methods joint displays
  • Visual tools and summary tables
  • Content and discourse analysis
ANSYS logoCOMSOL logo

ANSYS & COMSOL

Simulation Hover for details

Used for

Finite element, CFD and multiphysics simulation for mechanical, civil, electrical and chemical engineering.

What we do in it

  • Geometry, meshing and boundary conditions
  • Structural, thermal and CFD analysis
  • Multiphysics coupling (COMSOL)
  • Mesh-independence and validation

All product names, logos and trademarks belong to their respective owners and are shown only to identify the software we work with. Insightians is not affiliated with or endorsed by these companies.

Don't see your software? We also work with Excel, LISREL, Mplus, WarpPLS, GraphPad Prism, SolidWorks, AutoCAD, LabVIEW and more — just ask.

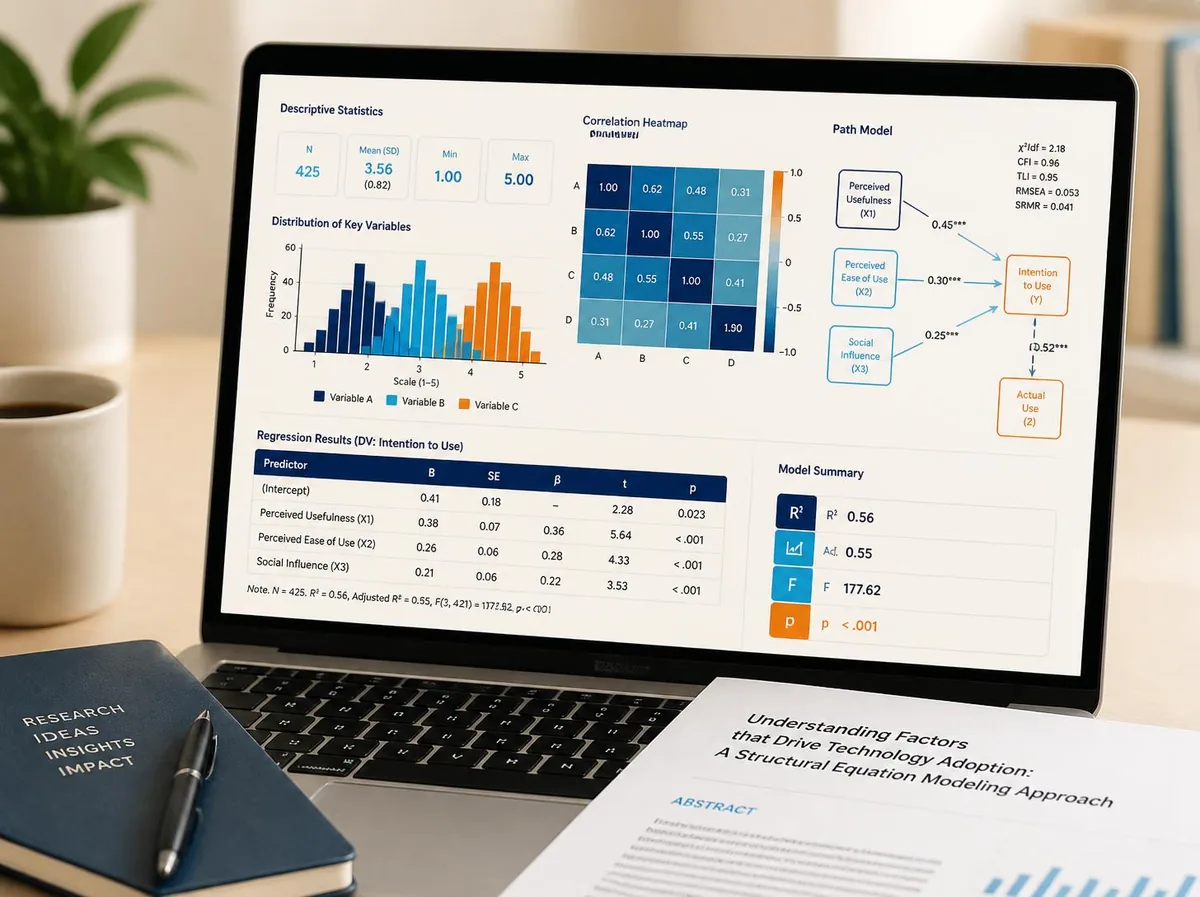
Statistical analysis output with charts and a path model on a laptop
Not sure which tool?

We'll recommend the right platform

The best software depends on your research design, data, university expectations and the licences you have access to.

  • Matched to your research questions and data type
  • Free alternatives suggested when licences are an issue
  • Full output files plus a plain-language explanation
  • One-to-one training if you want to run it yourself
Get started

What are you looking for?

Expert help on your project, or the skills to do it yourself — start with a free consultation either way.

I need research support

Guidance, analysis, editing or publication help from a subject-matched expert — with a clear quote before you commit.

Request a quote

I want to learn the skills

Live one-to-one training in research methods, SPSS, SmartPLS, R, Python and academic writing — built around your own project.

Explore training